Classify the disclosure
Identify AI exploration and deployment, then classify technologies, applications, integration depth, and named providers.
Research data · 2011–2024
A disclosure-based measurement system that separates signal from deployment and traces when firms adopt, where AI spreads, what firms use it for, and how deeply it is integrated.
I use large-language models to classify corporate disclosures and build annual firm-level measures of AI adoption. The exhibits below show how adoption spreads across firms and industries, how deeply it is integrated, and what firms use it for.
Measurement framework
Disclosure → annual measures → adoption historyIdentify AI exploration and deployment, then classify technologies, applications, integration depth, and named providers.
Combine disclosure evidence for 4,313 firms over 2011–2024.
Identify each firm’s first adoption disclosure and trace disclosed adoption over time and across industries.
“Adoption” on this page means disclosed adoption. A first disclosure is an observed disclosure date, not necessarily the date of internal implementation.
01 / Firm-level diffusion
The figure distinguishes firms that have ever disclosed AI adoption, firms disclosing adoption in a given year, and firms making their first adoption disclosure in that year.
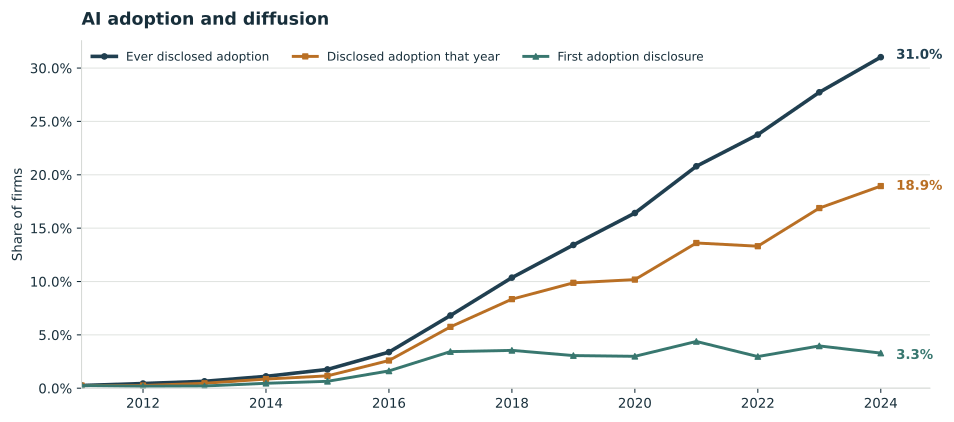
These are disclosure-based measures: firms may use AI without discussing it publicly.
| Year | Ever disclosed | Disclosed this year | First disclosure | Ever share |
|---|---|---|---|---|
| 2011 | 11 | 11 | 11 | 0.3% |
| 2012 | 19 | 11 | 8 | 0.4% |
| 2013 | 28 | 20 | 9 | 0.6% |
| 2014 | 48 | 37 | 20 | 1.1% |
| 2015 | 76 | 50 | 28 | 1.8% |
| 2016 | 146 | 112 | 70 | 3.4% |
| 2017 | 294 | 248 | 148 | 6.8% |
| 2018 | 447 | 360 | 153 | 10.4% |
| 2019 | 579 | 426 | 132 | 13.4% |
| 2020 | 708 | 439 | 129 | 16.4% |
| 2021 | 897 | 587 | 189 | 20.8% |
| 2022 | 1025 | 574 | 128 | 23.8% |
| 2023 | 1196 | 728 | 171 | 27.7% |
| 2024 | 1338 | 817 | 142 | 31.0% |
| Year | Ever disclosed | Disclosed this year | First disclosure | Ever share |
|---|---|---|---|---|
| 2011 | 0 | 0 | 0 | 0.0% |
| 2012 | 0 | 0 | 0 | 0.0% |
| 2013 | 0 | 0 | 0 | 0.0% |
| 2014 | 0 | 0 | 0 | 0.0% |
| 2015 | 1 | 1 | 1 | 0.0% |
| 2016 | 4 | 4 | 3 | 0.1% |
| 2017 | 7 | 6 | 3 | 0.2% |
| 2018 | 10 | 8 | 3 | 0.2% |
| 2019 | 16 | 12 | 6 | 0.4% |
| 2020 | 24 | 18 | 8 | 0.6% |
| 2021 | 31 | 17 | 7 | 0.7% |
| 2022 | 47 | 26 | 16 | 1.1% |
| 2023 | 325 | 314 | 278 | 7.5% |
| 2024 | 483 | 399 | 158 | 11.2% |
02 / Across industries
Within-industry adoption rate. The heatmap shows, for each industry and year, the share of firms that have disclosed AI adoption. The 2024 ranking compares those within-industry rates.
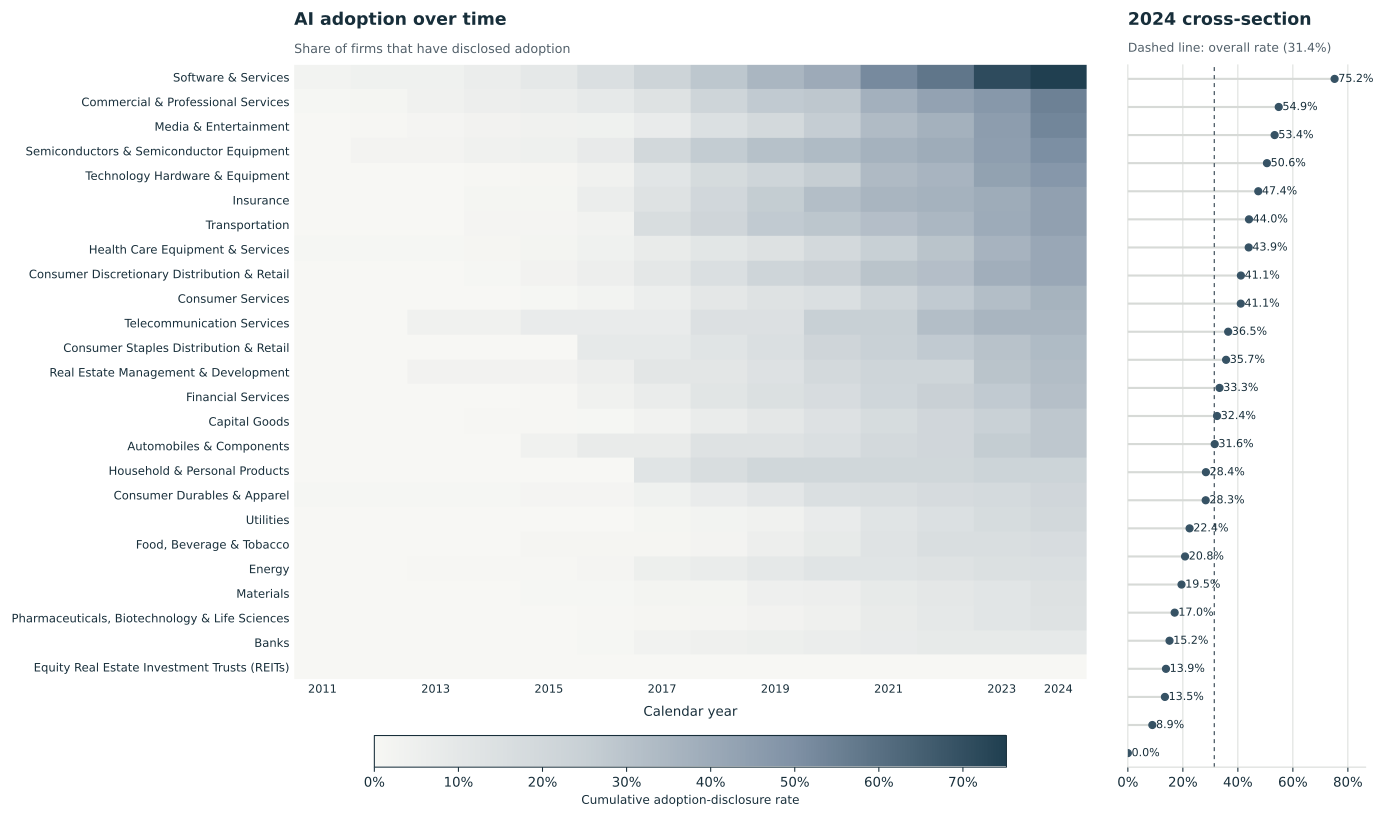
Industry coverage includes 98.7% of firms. Rates describe disclosed adoption, not industry performance.
| Industry group | Panel firms | Ever disclosed by 2024 | 2024 cumulative rate |
|---|---|---|---|
| Software & Services | 286 | 215 | 75.2% |
| Commercial & Professional Services | 144 | 79 | 54.9% |
| Media & Entertainment | 178 | 95 | 53.4% |
| Semiconductors & Semiconductor Equipment | 87 | 44 | 50.6% |
| Technology Hardware & Equipment | 194 | 92 | 47.4% |
| Insurance | 84 | 37 | 44.0% |
| Transportation | 66 | 29 | 43.9% |
| Health Care Equipment & Services | 326 | 134 | 41.1% |
| Consumer Discretionary Distribution & Retail | 151 | 62 | 41.1% |
| Consumer Services | 159 | 58 | 36.5% |
| Telecommunication Services | 28 | 10 | 35.7% |
| Consumer Staples Distribution & Retail | 33 | 11 | 33.3% |
| Real Estate Management & Development | 37 | 12 | 32.4% |
| Financial Services | 285 | 90 | 31.6% |
| Capital Goods | 370 | 105 | 28.4% |
| Automobiles & Components | 53 | 15 | 28.3% |
| Household & Personal Products | 49 | 11 | 22.4% |
| Consumer Durables & Apparel | 125 | 26 | 20.8% |
| Utilities | 82 | 16 | 19.5% |
| Food, Beverage & Tobacco | 94 | 16 | 17.0% |
| Energy | 231 | 35 | 15.2% |
| Materials | 166 | 23 | 13.9% |
| Pharmaceuticals, Biotechnology & Life Sciences | 690 | 93 | 13.5% |
| Banks | 337 | 30 | 8.9% |
| Equity Real Estate Investment Trusts (REITs) | 1 | 0 | 0.0% |
| Industry group | Panel firms | Ever disclosed by 2024 | 2024 cumulative rate |
|---|---|---|---|
| Software & Services | 286 | 154 | 53.8% |
| Media & Entertainment | 178 | 58 | 32.6% |
| Commercial & Professional Services | 144 | 36 | 25.0% |
| Real Estate Management & Development | 37 | 6 | 16.2% |
| Consumer Services | 159 | 24 | 15.1% |
| Technology Hardware & Equipment | 194 | 29 | 14.9% |
| Financial Services | 285 | 41 | 14.4% |
| Telecommunication Services | 28 | 4 | 14.3% |
| Consumer Discretionary Distribution & Retail | 151 | 21 | 13.9% |
| Semiconductors & Semiconductor Equipment | 87 | 12 | 13.8% |
| Health Care Equipment & Services | 326 | 31 | 9.5% |
| Consumer Staples Distribution & Retail | 33 | 3 | 9.1% |
| Transportation | 66 | 6 | 9.1% |
| Insurance | 84 | 7 | 8.3% |
| Food, Beverage & Tobacco | 94 | 6 | 6.4% |
| Household & Personal Products | 49 | 3 | 6.1% |
| Utilities | 82 | 4 | 4.9% |
| Capital Goods | 370 | 11 | 3.0% |
| Materials | 166 | 4 | 2.4% |
| Automobiles & Components | 53 | 1 | 1.9% |
| Pharmaceuticals, Biotechnology & Life Sciences | 690 | 13 | 1.9% |
| Consumer Durables & Apparel | 125 | 2 | 1.6% |
| Banks | 337 | 5 | 1.5% |
| Energy | 231 | 2 | 0.9% |
| Equity Real Estate Investment Trusts (REITs) | 1 | 0 | 0.0% |
Industry composition
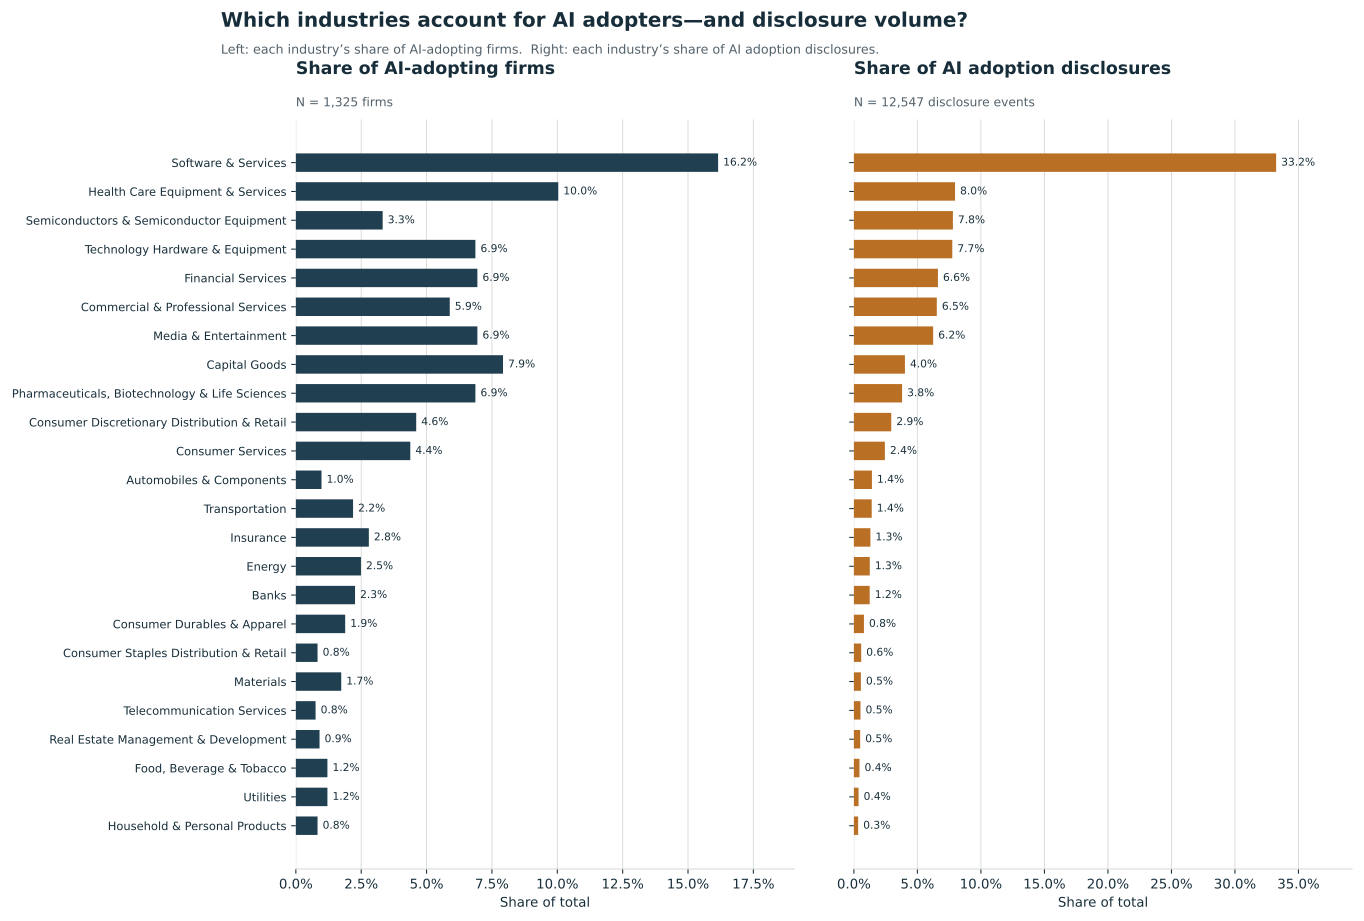
Composition of the adopter sample. The left bars show each industry’s share of all AI-adopting firms; the right bars show its share of AI adoption disclosures. Unlike the heatmap above, these are shares of the total adopter/disclosure sample—not within-industry adoption rates.
| Industry group | Adopter firms | Firm share | Adoption disclosures | Disclosure share |
|---|---|---|---|---|
| Software & Services | 214 | 16.2% | 4171 | 33.2% |
| Health Care Equipment & Services | 133 | 10.0% | 999 | 8.0% |
| Semiconductors & Semiconductor Equipment | 44 | 3.3% | 978 | 7.8% |
| Technology Hardware & Equipment | 91 | 6.9% | 972 | 7.7% |
| Financial Services | 92 | 6.9% | 830 | 6.6% |
| Commercial & Professional Services | 78 | 5.9% | 819 | 6.5% |
| Media & Entertainment | 92 | 6.9% | 783 | 6.2% |
| Capital Goods | 105 | 7.9% | 504 | 4.0% |
| Pharmaceuticals, Biotechnology & Life Sciences | 91 | 6.9% | 476 | 3.8% |
| Consumer Discretionary Distribution & Retail | 61 | 4.6% | 369 | 2.9% |
| Consumer Services | 58 | 4.4% | 306 | 2.4% |
| Automobiles & Components | 13 | 1.0% | 178 | 1.4% |
| Transportation | 29 | 2.2% | 176 | 1.4% |
| Insurance | 37 | 2.8% | 163 | 1.3% |
| Energy | 33 | 2.5% | 157 | 1.3% |
| Banks | 30 | 2.3% | 156 | 1.2% |
| Consumer Durables & Apparel | 25 | 1.9% | 99 | 0.8% |
| Consumer Staples Distribution & Retail | 11 | 0.8% | 72 | 0.6% |
| Materials | 23 | 1.7% | 69 | 0.5% |
| Telecommunication Services | 10 | 0.8% | 65 | 0.5% |
| Real Estate Management & Development | 12 | 0.9% | 62 | 0.5% |
| Food, Beverage & Tobacco | 16 | 1.2% | 55 | 0.4% |
| Utilities | 16 | 1.2% | 46 | 0.4% |
| Household & Personal Products | 11 | 0.8% | 42 | 0.3% |
03 / Integration depth
The underlying classification distinguishes initial, intermediate, and advanced integration among substantive AI disclosures.
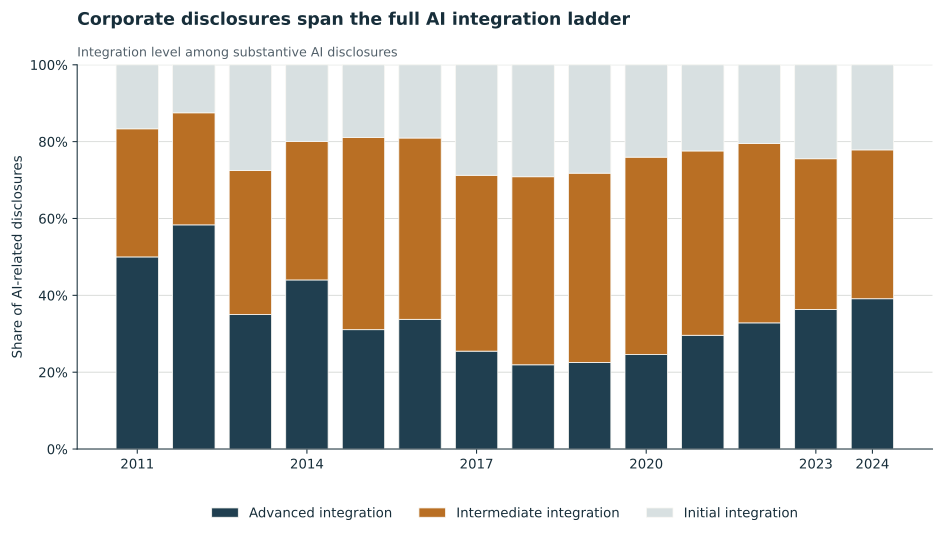
Across 2011–2024, the shares are 24.0% initial, 44.3% intermediate, and 31.7% advanced.
| Year | Initial | Intermediate | Advanced |
|---|---|---|---|
| 2011 | 16.7% | 33.3% | 50.0% |
| 2012 | 12.5% | 29.2% | 58.3% |
| 2013 | 27.5% | 37.5% | 35.0% |
| 2014 | 20.0% | 36.0% | 44.0% |
| 2015 | 18.9% | 50.0% | 31.1% |
| 2016 | 19.1% | 47.2% | 33.8% |
| 2017 | 28.8% | 45.8% | 25.5% |
| 2018 | 29.1% | 48.9% | 21.9% |
| 2019 | 28.2% | 49.2% | 22.6% |
| 2020 | 24.0% | 51.3% | 24.6% |
| 2021 | 22.4% | 48.0% | 29.6% |
| 2022 | 20.5% | 46.7% | 32.8% |
| 2023 | 24.5% | 39.2% | 36.3% |
| 2024 | 22.1% | 38.7% | 39.1% |
04 / Applications
A single AI disclosure can describe more than one application. The figure shows how the disclosed application mix changes over time, including the sharp rise of generative and interactive applications after 2022.
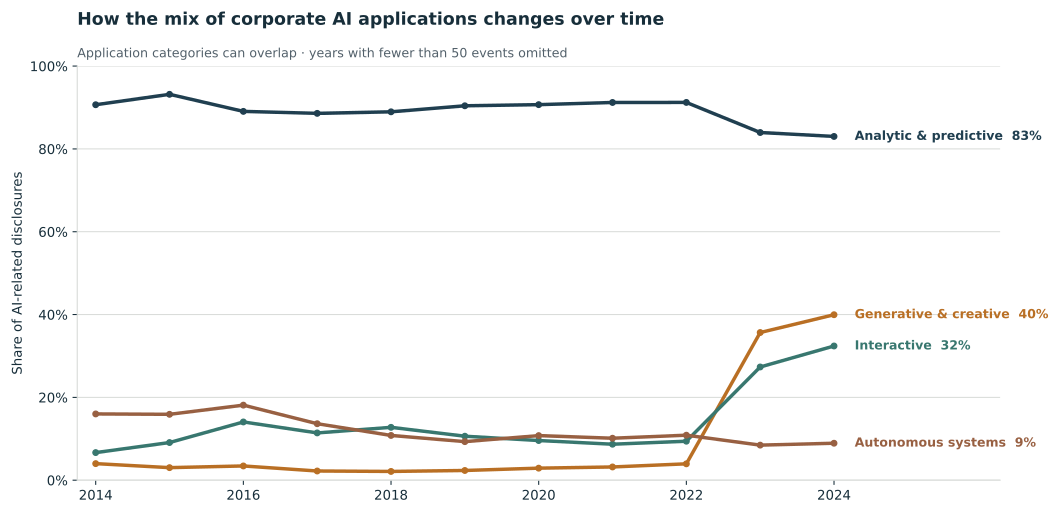
Shares are among AI-related disclosures; categories can overlap and need not sum to 100%.
| Application type | Events | Denominator | Share |
|---|---|---|---|
| Analytic & predictive | 2902 | 3496 | 83.0% |
| Generative & creative | 1397 | 3496 | 40.0% |
| Interactive | 1133 | 3496 | 32.4% |
| Autonomous systems | 312 | 3496 | 8.9% |
05 / Named providers across industries
Providers named in AI adoption disclosures, connected to the sectors of the disclosing firms. Ribbon widths count distinct firm–provider pairs over 2011–2024.
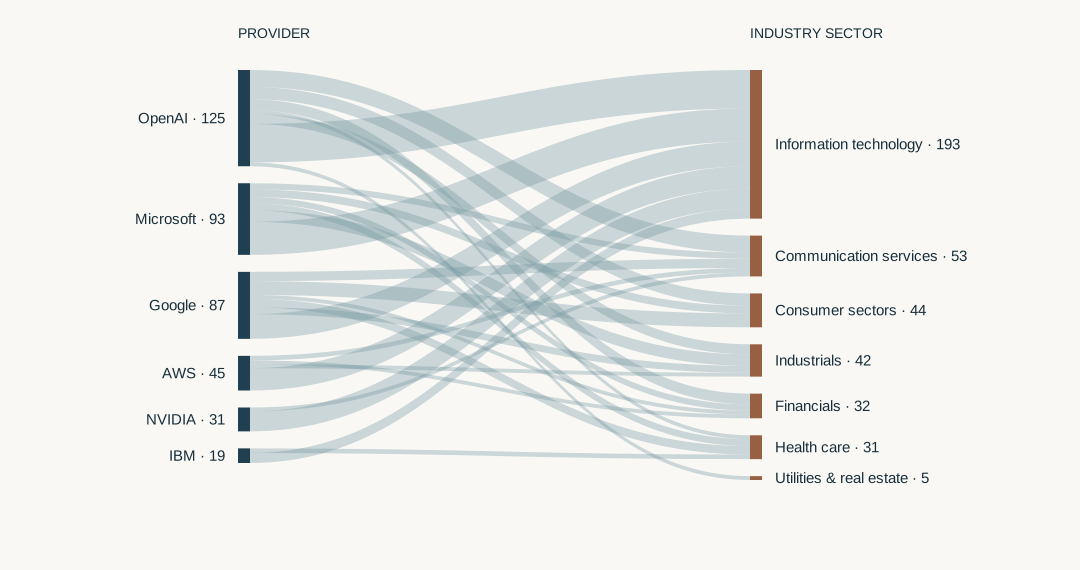
Six leading named providers are shown. A firm can name more than one provider; ribbon widths are counts, not market shares, contract values, or verified vendor relationships.
Each firm–provider pair is counted once over the full period. Related sectors are grouped for readability, and only larger links are displayed.
| Provider | Sector | Firm–provider pairs |
|---|---|---|
| OpenAI | Communication services | 22 |
| OpenAI | Consumer sectors | 16 |
| OpenAI | Financials | 14 |
| OpenAI | Health care | 5 |
| OpenAI | Industrials | 13 |
| OpenAI | Information technology | 50 |
| OpenAI | Utilities & real estate | 5 |
| Microsoft | Communication services | 8 |
| Microsoft | Consumer sectors | 10 |
| Microsoft | Financials | 8 |
| Microsoft | Health care | 9 |
| Microsoft | Industrials | 15 |
| Microsoft | Information technology | 43 |
| Communication services | 12 | |
| Consumer sectors | 18 | |
| Financials | 5 | |
| Health care | 11 | |
| Industrials | 9 | |
| Information technology | 32 | |
| AWS | Communication services | 6 |
| AWS | Financials | 5 |
| AWS | Industrials | 5 |
| AWS | Information technology | 29 |
| NVIDIA | Communication services | 5 |
| NVIDIA | Information technology | 26 |
| IBM | Health care | 6 |
| IBM | Information technology | 13 |
The public page intentionally stops at descriptive measurement. It does not report valuation estimates, causal effects, portfolio returns, labor-market treatment effects, or other paper-specific results.